
Authors: Frank Neffke, Sid Ravinutala, and Bruno Zuccolo
Tourism is an important sector in the global economy. Today, 10.4% of the world’s GDP and 7% of the world’s total exports come from tourism. The industry is worth over US$ 1.1 trillion. The money earned from expenditures by foreigners are crucial drivers of economic development and can be an important source of foreign exchange. Moreover, growing tourism can help create employment opportunities for marginalized populations.
However, due to a lack of data, we have only a limited understanding of tourism’s role in the global economy: Which countries do the visitors who spend the most come from? What are the most visited places? What types of businesses do tourists spend their money on? The Center for International Development (CID) is collaborating with the Mastercard Center for Inclusive Growth to better understand these issues and explore tourism’s impact on economies across the world. Through the collaboration, CID researchers have been able to use anonymized and aggregated transaction data1 to study foreign tourist spending2 patterns in 40 countries from 2011 to 2016, including most of Europe, the United States, and select countries in South America and Oceania. These destinations account for over 60% of all tourism in the world.
Across 40 countries in our data
Tourism accounts for more than 8% of this expanded definition of exports
Comparable to the trade in oil and energy, and agricultural products
How important is tourism as an export category?
In a globalized world, the products we consume are increasingly produced elsewhere and firms often source their machinery and raw materials from across the globe. This all happens seamlessly: most consumers are often unaware of where merchandise was produced. However, at the level of a national economy, to pay for imports, a country has to amass foreign exchange: it has to sell something in return to customers outside its borders. Countries pay for their imports by exporting goods, services and capital—that is, by trading with other countries. When we envision this trade, we picture shiploads of toys, cars and raw materials crisscrossing the globe; but this is only one version of trade. Foreigners can also buy goods and services by coming to our country, an activity also known as tourism. In this sense, tourism is a substantial component of global trade.
Note that in this story, it does not matter much what is sold to foreign visitors, as long as they pay with money earned elsewhere. In this wider definition, tourism income is not limited to restaurant and hotel bills, but includes all types of expenditures ranging from transportation to medical care to clothing and educational services. However, unlike trade in goods, which is recorded by customs offices at the border, national statistics often only provide a poor account of tourism income. With exports of goods, we know exactly how much and which products are traded with whom, yet we have a vague understanding of how a country earns foreign exchange from tourists.
In our research, we added up a country’s tourism income with its income from traditional exports of goods. For the total tourism income for a country, we rely on national aggregates reported by the IMF and leverage aggregated and anonymized transaction data provided by Mastercard to divide the total expenditures into different categories, based on what these data indicate about the types of merchants where tourists spend their money.
Across the 40 countries, our data show that tourism tourism accounts for over 8 percent of this expanded definition of exports, making it comparable to trade in oil and energy, and just slightly smaller than trade in agricultural products. Figure 1 shows the breakdown of exports by category, with tourism expenditures depicted in red.
Figure 1 – Total export of goods and tourism by sector, for the 40 countries analyzed
Sources: The Atlas of Economic Complexity, IMF, and Mastercard
Total expenditures by tourists (the absolute size of the red rectangle) are taken from the IMF. The relative breakdown by expenditure type within tourism is gleaned from leveraging insights based on Mastercard’s aggregated and anonymized transaction data. Choose a country from the drop-down menu to explore the importance of tourism as an export for individual countries by year. Click on any of the industries to see the breakdown of exports within that industry, including types of tourism.
There is substantial variation across countries. For some countries, tourism is almost as important a source of foreign exchange as all exported goods combined: in Cyprus the share of tourism in our expanded exports definition is 52 percent, in Croatia it is 42 percent, in Iceland 39 percent, in Greece 36 percent and in Luxembourg 22 percent. While Croatia and Greece are well-known tourist destinations, the reliance of Luxembourg on tourism revenues may be more surprising. Here, it is important to remember that the definition of tourism, the one relevant from a foreign exchange perspective, encompasses all purchases of goods and services made by foreign citizens in a particular country. This includes income of typical tourist industries, such as hospitality and entertainment, but also of education, health care, and shops. Much of the tourism expenditures in Luxembourg are related to visitors from neighboring countries shopping for groceries or filling up their tanks at lower-taxed gas stations.
Is the Mastercard spend index a reliable reflection of tourism expenditures?
Many governments provide high-level information on tourism income in their balance of payment statistics. We can compare yearly tourism income reported by the IMF to the index of expenditures based on Mastercard’s aggregated and anonymized transaction data for each of the 40 countries over a six-year period. As shown in the scatterplot of Figure 2, the two measures line up very well on a log scale. The correlation of 0.932 shows that the Mastercard spend index provides highly reliable estimates of the distribution of tourism across countries and years.
Figure 2 – Correlation of revenues by country and year
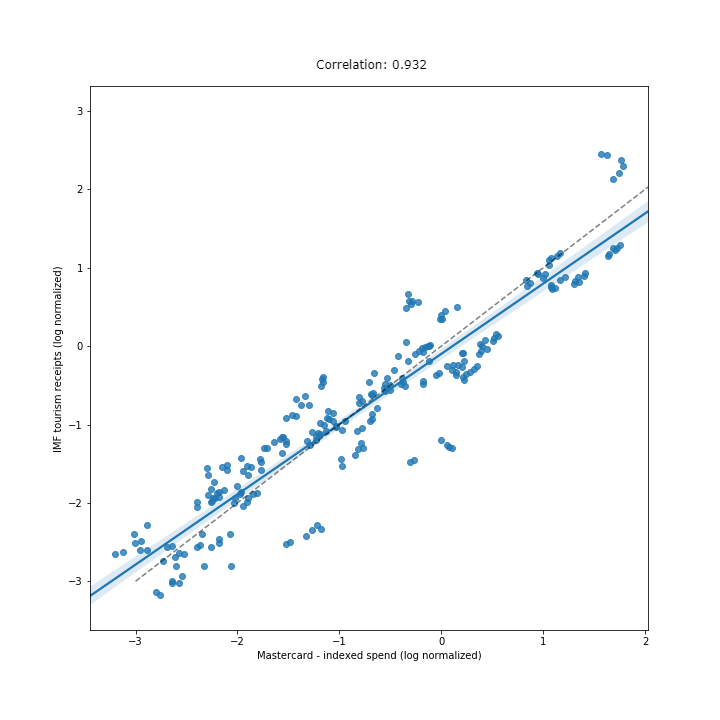
Source: International Monetary Fund (2018) and indexed tourism spend based on Mastercard’s aggregated and anonymized transaction data
To explore the growth of tourism, Figure 3 plots how the index of tourism expenditures changes in each of the destination countries over time, using 2011 as the base year. The dotted line represents the average of the 40 countries.
Figure 3: Yearly indexed spend trends by country, 2011-2016
Whereas average growth in tourism in our sample of countries was rather flat, there are some fast-growing destinations, with Iceland (19% annualized growth rate), Colombia (9.3%), Malta (8.3%), Lithuania (7.1%) and Romania (6.9%) leading the pack. Iceland’s growth has far outpaced any of its peers’, riding a strong and long-lasting tourism boom that helped it recover more quickly from the 2008 financial crisis. It’s a remarkable success for a small country that has invested heavily in marketing itself as a hub between Europe and North America through its flagship airline Icelandair.
Where is this growth coming from? Figure 4 shows the origins of the increase in tourist expenditures in the United States. Asian countries form a fast-growing market for the United States, but we also see some growth from eastern European countries, Australia and New Zealand. One of the most striking features of the map in Figure 4, however, is the rise of tourism from China, which has grown at a whopping 22 percent a year since 2011. On the other end of the spectrum, we see an astounding 43 percent a year contraction in Venezuelan tourism expenditures, a reflection of the precipitous collapse of the Venezuelan economy.
Figure 4 – Annual growth of indexed spend in the USA by origin countries, 2011-2016
Payment card data insights: tourism under the microscope
For the analyses so far (except Figure 4), we could have just relied on the statistics the IMF provides. However, Mastercard’s aggregated and anonymized transaction data also allows us to zoom in on tourism, by breaking down expenditures in different ways. First of all, we can look at the types of merchants where tourists make purchases. Mastercard classified all merchants accepting payment cards into 27 categories. By far the largest is “Finance and Insurance,” accounting for about a quarter of total spending. This category includes all the money withdrawn from ATMs by foreign cardholders, but it does not indicate the merchants where the tourists are spending the cash they withdraw. Therefore, we focus on the expenditures in the remaining merchant types, which are depicted in Figure 5.
Figure 5 – Share of total indexed spend by merchant type in all countries
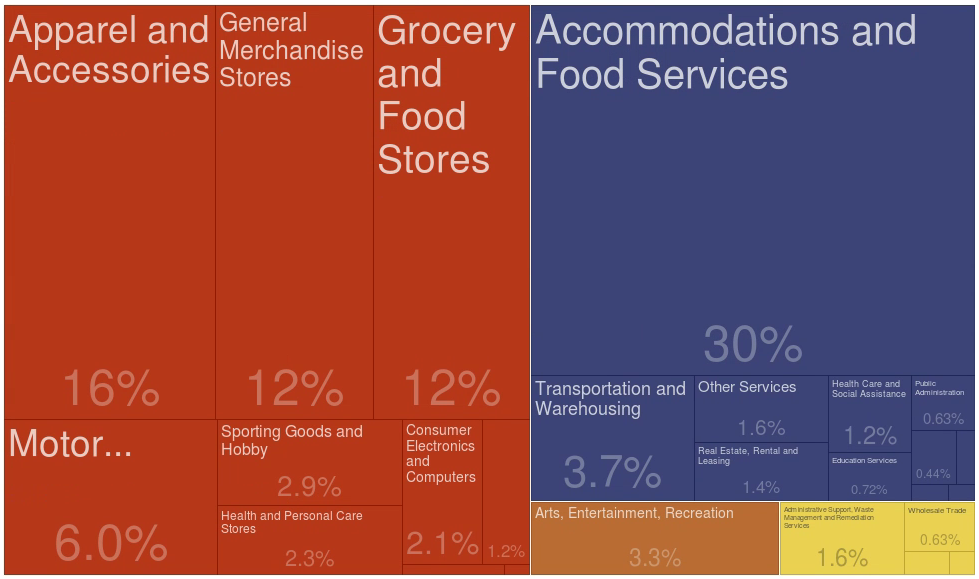
Figure 5 immediately highlights one of the main benefits offered by Mastercard’s aggregated and anonymized transaction data. What we would typically think of as the “tourism sector”—the hotels, restaurants, and other hospitality services in a country (here classified as “Accommodations and Food Services”)—make up just 30% of all tourist expenditures. Focusing on this one sector would therefore miss most of the economic impact of tourism (it also risks erroneously classifying expenditures by locals in hotels and restaurants as “tourism.” Instead, our analysis reveals that foreigners also spend significant amounts on “Apparel and Accessories,” “Grocery and Food Stores,” and more.
Apart from knowing what categories tourists spend their money on, we can also see where they spend it. This allows us to compare cities in terms of what tourists are looking for when they visit a place. As an example, take Figures 6 and 7, which compare the expenditure patterns of tourists in Naples and Milan:
Figure 6 – Spend by merchant type in Naples (2016)

Figure 7 – Spend by merchant type in Milan (2016)

Both cities attract many foreign visitors. However, they differ drastically in the services sought by these tourists. Naples earns most of its money through its many excellent restaurants and hotels, whereas tourists spend at about twice the rate in the clothing stores of Milan. Milan and Naples’ reputations as the fashion and culinary centers of Italy are thus clearly reflected in their visitors’ spending patterns.
Another way to compare cities is by origin of tourists. The figures below exemplify this by comparing Los Angeles to New York City:
Figure 8 – Spend by origin in Los Angeles (2016)
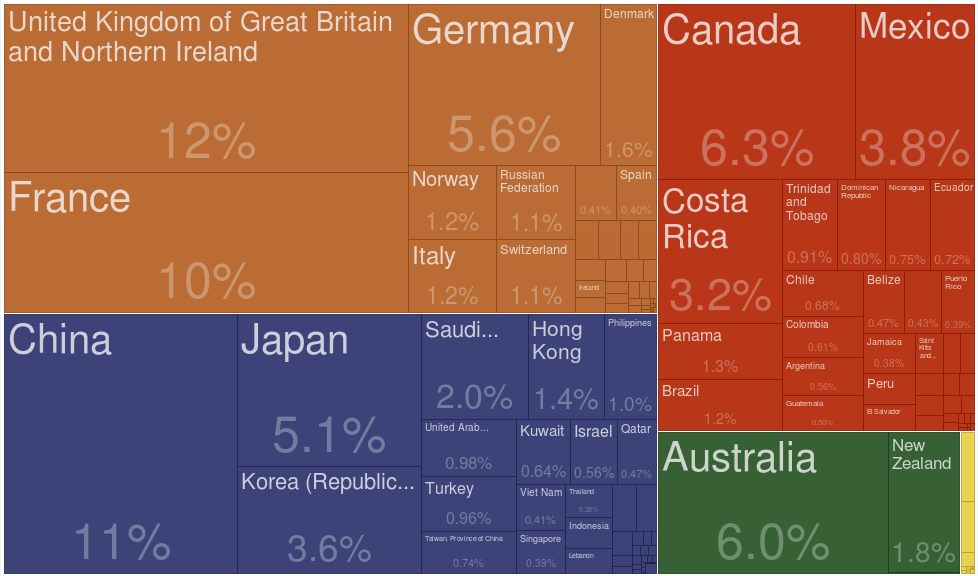
Figure 9 – Spend by origin in New York (2016)

Located on opposite coasts, NYC and LA have very different tourist profiles. Tourism in NYC is dominated by European visitors, while LA’s relative proximity to other Pacific nations makes it an attractive destination for tourists from Asia and Oceania. For instance, the share of tourism expenditures being made by tourists from China in LA is almost three times as large as in NYC.
These graphs show how Mastercard’s aggregated and anonymized transaction data allow us to break down tourism in various, meaningful ways. This gives us a unique lens on the nature of tourism as an export category and provides us with an invaluable tool for understanding the role of tourism in inclusive growth. It helps address questions such as: How can we classify tourism into different types? What kind of services do different types of tourists require? Can we predict where new tourist destinations will arise and who will visit them? And, most importantly, can tourism accelerate economic development and be a source of inclusive growth? – Stay tuned!
1The Mastercard Center for Inclusive Growth is committed to advancing sustainable and equitable economic growth and financial inclusion around the world, collaborating with a diverse community of academic and research institutions by providing access to aggregated and anonymized transaction data. In its collaboration with CID, Mastercard provided controlled access to data that was aggregated, anonymized, and subject to additional privacy and data protection safeguards. In addition to these safeguards, access to the data was provided for academic research purposes only and subject to Harvard University's stringent confidentiality requirements.
2Data on expenditures was aggregated to a combination of a country of origin, a location within a country of destination, and a merchant type for a given time window. Absolute expenditure values were replaced by an index that makes relative comparisons across the data set. Additionally, expenditures were scaled to reflect spend in the foreign expenditures market as a whole, not just the share serviced by Mastercard.
Media inquiries
Contact: Chuck McKenney
Email: chuck_mckenney@hks.harvard.edu
Phone: (617) 495-8496
Date: Nov. 1, 2018